

Video: How to use analysis tools (in Danish with English subtitles)
You can use the ‘Analysis’ tool to get a quick overview of your distributions, but you can also delve into deeper, more detailed information.
Choose filters to see what you want
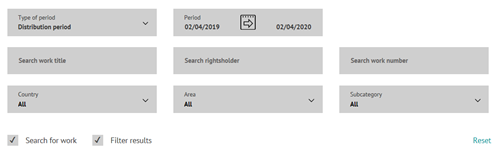
The filters applied at the top of the webpage govern what you see on the rest of the page. By default, the ‘Analysis’ page shows the distribution period covering the last year.
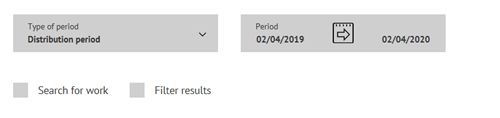
‘Search for work’ enables you to search by title, rightsholder and work number.
‘Filter result’ gives you the opportunity to filter your distributions by Country, Area and Sub-area.
You can also filter by
- rights, which covers the sections/areas your music is used in. For example, if you choose ‘Radio’, you will view results for ‘Radio’ in Denmark and abroad
- role, which means filtering the results by your role as composer (C) or author (A) or both (CA)
- programme search, which filters the result by the broadcasts/programmes/shows in which your music has been used
Get your results in Excel
If you want to transfer your results to Excel, click on the icons CSV or XLSX. You can also choose to have the result sent to you via email (useful if there is a lot of data) by clicking on the mail icons for, respectively, CSV or XLSX.
XLCS = Excel file
CSV = Comma separated values file
Overall, the areas are divided into Koda areas (such as Radio, TV, Concert or Online) ad NCB areas (Streaming, Downloads etc.) Choose sub-areas to filter by specific radio stations, TV stations and so on.
More about the various functions:
- Distribution areas
-
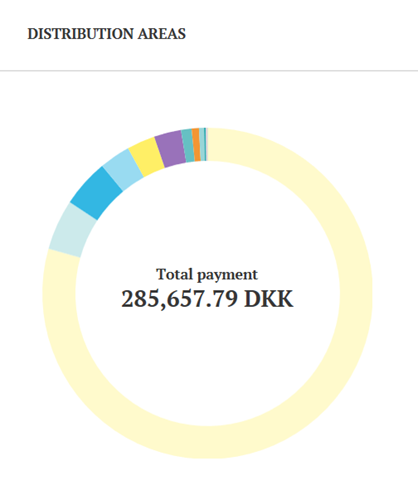
The ‘Distribution areas’ chart shows your total distributions for the chosen period and how your revenues are distributed by area.You can simply mouse-over to see precisely which area each colour represents, the amount distributed within the area and its relative share (in per cent) of your total distribution.
- Distribution per country
-
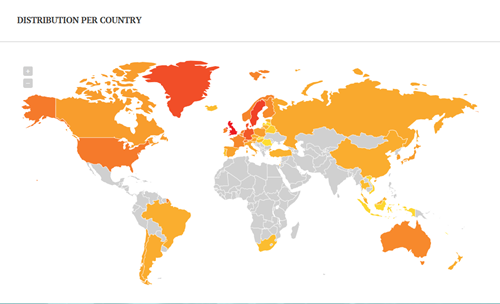
The map overview provides information about the level of revenues generated by your music within the chosen period, arranged by country – meaning that it provides a clear image of where in the world your music has been performed.

- The colour coding shows you which countries account for the greatest parts of your distributions.
- The red areas generated the highest distributions within the given period, while the yellow countries indicate the countries which generated the lowest level of revenue.
- If a given country/area is grey, it generated no distributions for you within the period.
- Distributions
-
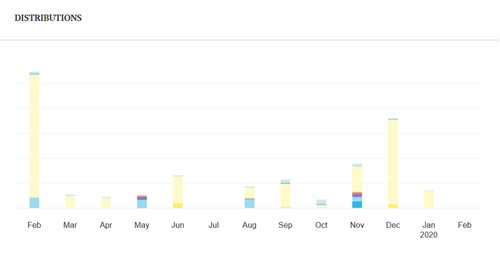
This provides an overview of your distributions arranged by month and distribution area. The colours represent the different distribution areas, and you can see more details about your distribution by simply using the mouse-over function.
- Top 5 works
-
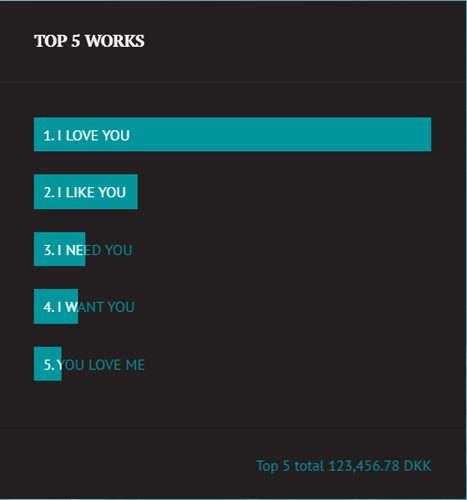
Top 5 Works shows the five works which generated the highest revenues within the chosen period. Mouse-over to see the amount and its relative share (in per cent) of the total amount distributed during the period.
The green bars illustrate the relative level of revenues generated by each of the five works in relation to each other, while the amount stated in the right-hand corner shows the total revenues generated by your Top 5 Works within the chosen period.
- Works
-
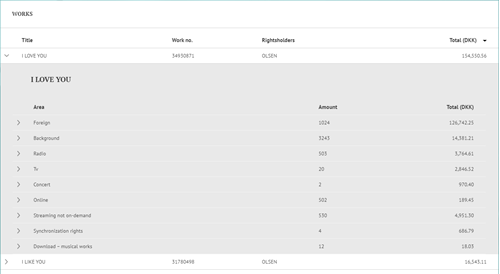
The list shows the top 50 works that generated the greatest revenues for you. The filtering options at the top of the page lets you get a quick overview of the highest-performing works by country and territory. For more detailed information on each work, click the arrow on the left.
You can sort your list by all four columns. The default sorting is set at 'Total (DKK)', but you can change this by clicking the column headers.
